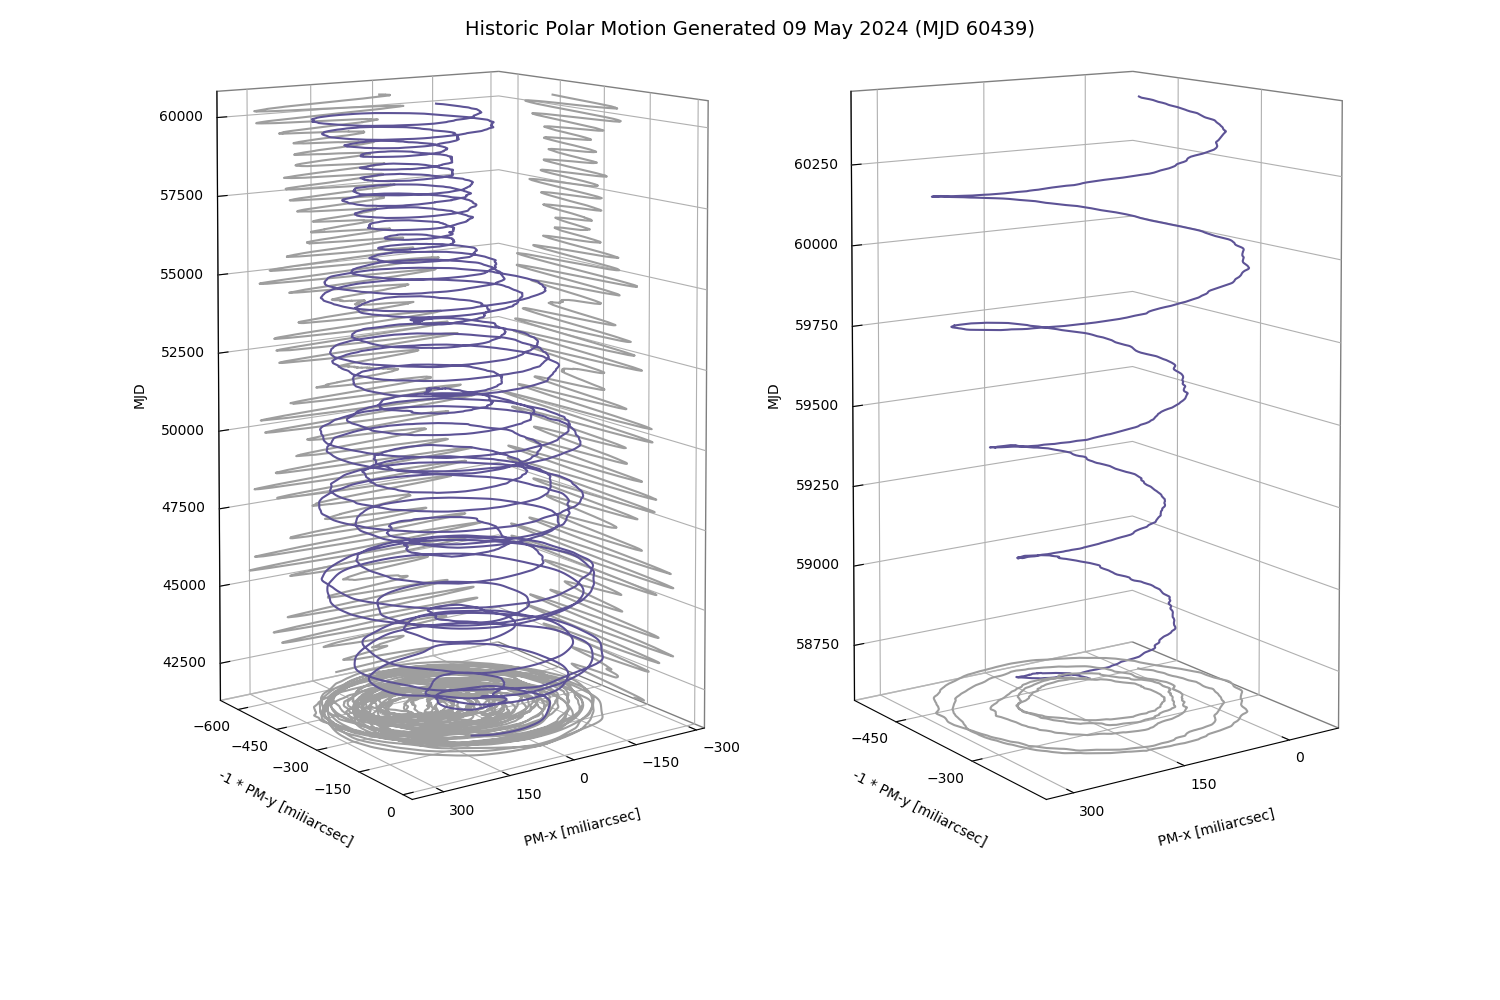
Polar motion over time, where time increases along the
z-axis in the positive direction. The plot on the left shows
polar motion since 1973, while the plot on the right shows
polar motion for the last 2 years.
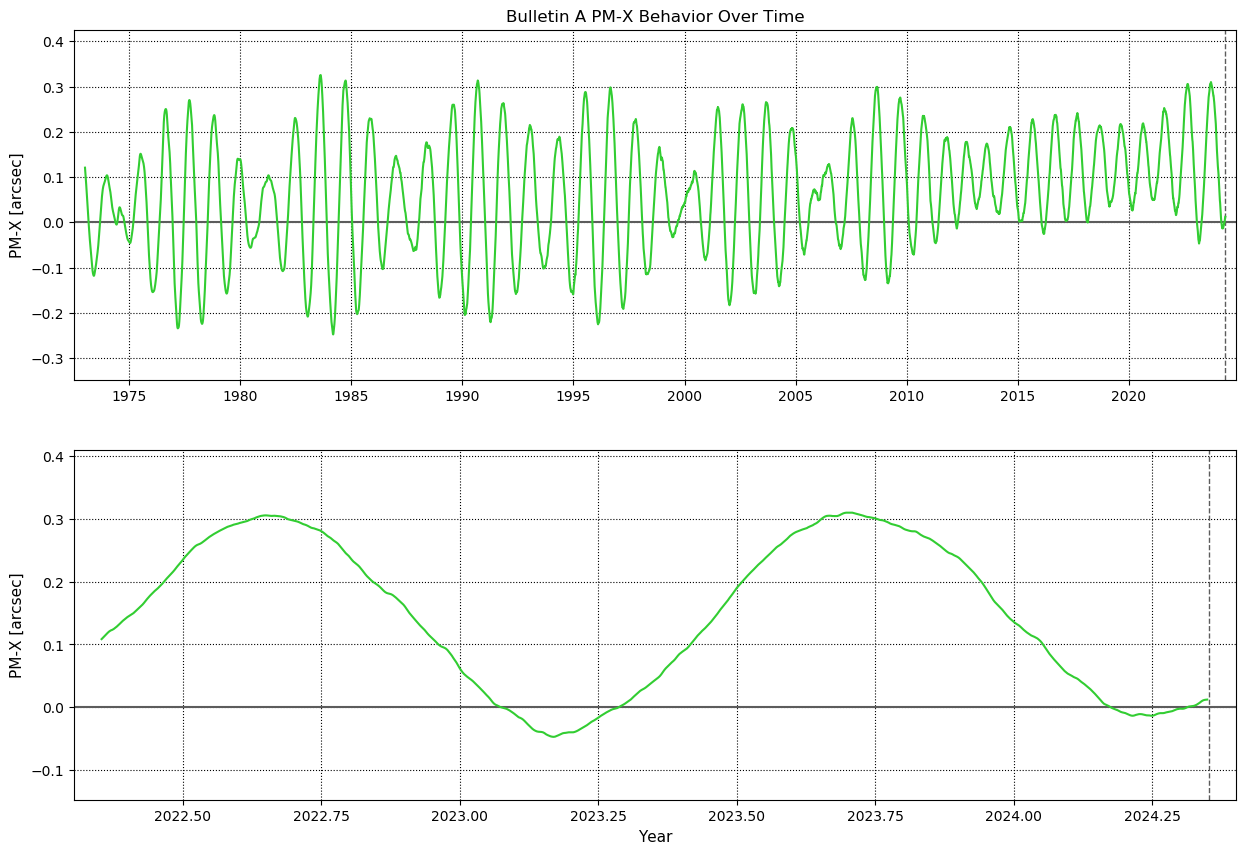
Polar Motion (PM) x over time. The top plot shows variations in
PM-x since 1973, while the bottom plot shows PM-x variations for
the last 2 years.
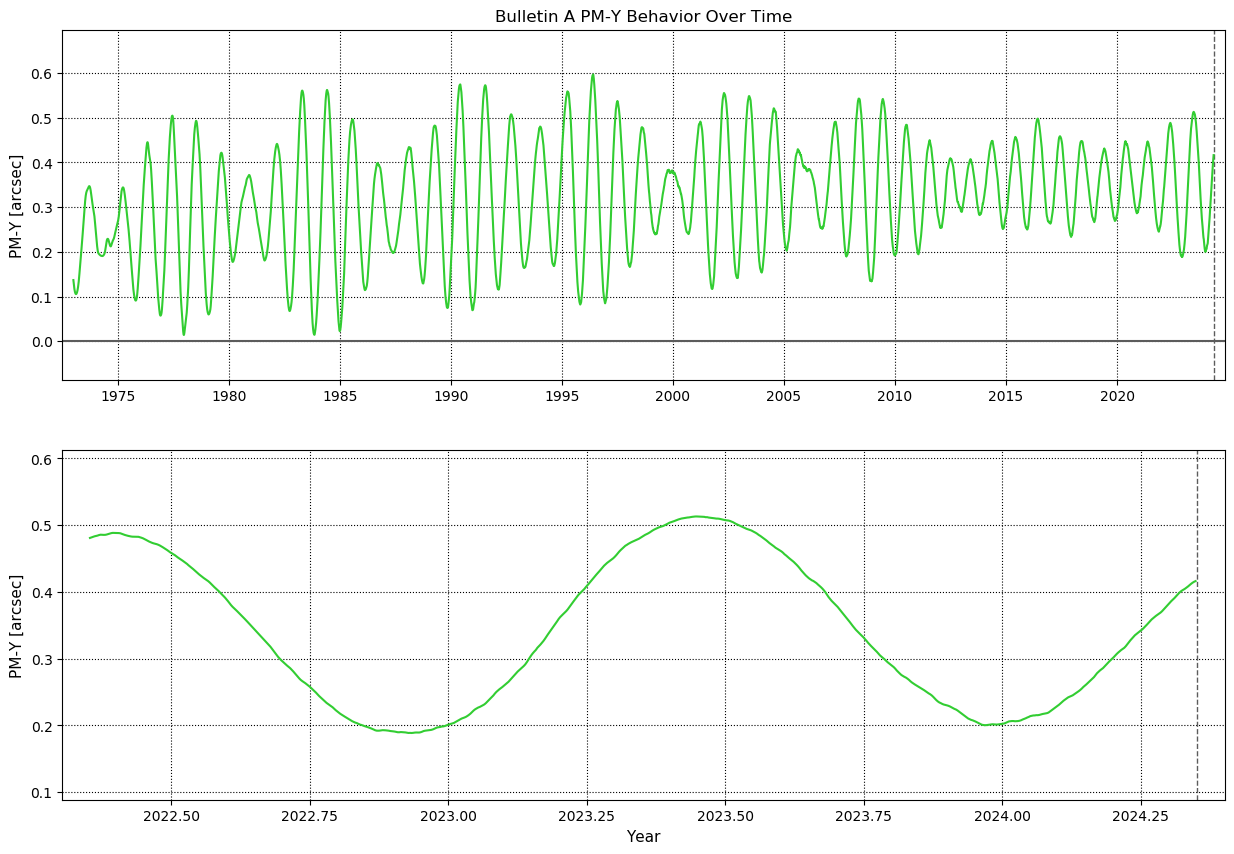
Polar Motion (PM) y over time. The top plot shows variations in
PM-y since 1973, while the bottom plot shows PM-y variations for
the last 2 years.
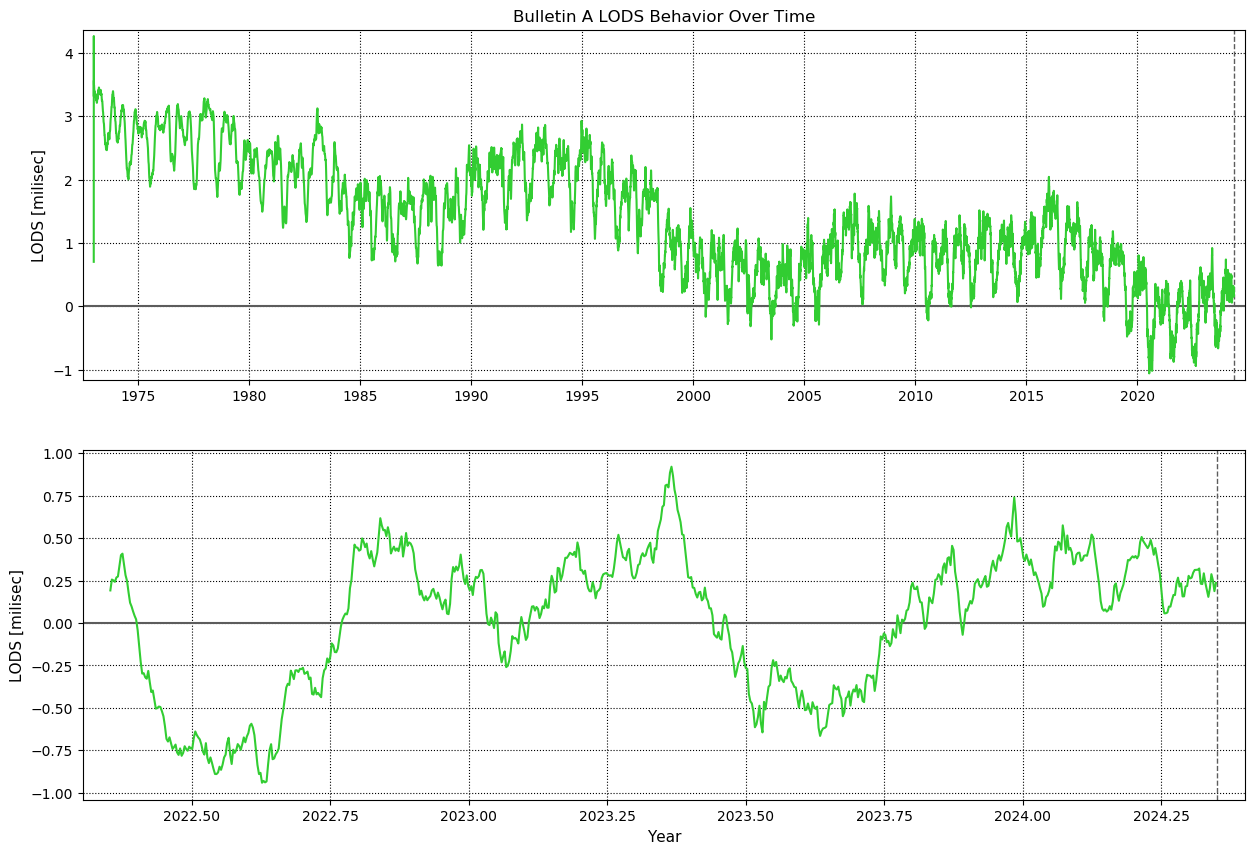
Length of Day (LOD)
Length of Day (LOD) over time, with solid-Earth tides
removed. The top plot shows variations in LOD since 1973, while
the bottom plot shows LOD variations for the last 2 years.